Introduction
Flat-files have been used around the world of the past few decades to store a lot of data. Flat-files were originally designed to save space, although they do have an intrinsic inefficiency because spaces are used as placeholders instead of using a delimiter, like a comma.
In some instances you can compact a lot of information into a small amount of space when you use a flat-file to store the information. Additionally, flat-files only contain data since they do not contain program-specific instructions or any additional information. If you work in data science long enough, you will encounter flat-files and you will need to be able to unpack, restructure and use the data that is stored in them. Unfortunately for us, sometimes to use this information requires a data rebuilding/restructuring process that might involve multiple steps and approaches that can be challenging to implement.
Alteryx is the best tool I have ever used for working with content stored in flat-files. Not only does Alteryx fly when it comes to pulling the data out of the file (click here), it gives you the tools to rebuild the data structures you need for efficient and effective visual and quantitative analysis. This article discusses how these tools are used to rebuild the data structures needed when the data is originating from a non-ideal flat-file structure.
In this context, I define a non-ideal file structure as one that requires you to do a lot of work to be able to use the data within the file. Sometimes people get too clever when originally deciding what data to store in the flat-files. Sometimes their decisions make it hard for other people to use the data when they do not have specialty processing codes that were originally written to process data in that flat-file structure.
In the example shown in this article, there are two facets of non-ideal behavior. First, there are no daily dates that are explicitly stored in the file. Secondly, the file stores daily data in monthly blocks, which requires a transposing routine to create daily records.
Motivation For This Blog Post
In a recent blog post (click here), I showed how climate data could be used with Alteryx and Tableau to answer some questions regarding precipitation at a monitoring station in Springfield, Illinois. The work completed for that article included developing an Alteryx workflow that was fairly sophisticated. There were some innovative approaches needed to restructure the climate data so that Tableau could be used to visualize the precipitation data. This article describes some of that work, with a focus given to extraction of the flat-file data followed by using Alteryx to restructure it for use in Tableau.
If you like this article and would like to see more of what I write, please subscribe to my blog by taking 5 seconds to enter your email address below. It is free and it motivates me to continue writing, so thanks!
The Climate Data Source
The world-wide climate data available for use by anyone is available for download by clicking here. The main file, which contains daily climate data from a worldwide monitoring network is currently 2.5 Gb in compressed format. The daily records for each monitoring station are stored in really ugly flat-files that were designed for maximum storage efficiency but create problems for data analysts that do not have specialty processing codes that were written for this file structure.
If you were to decompress all of the available files and write out one record for each variable for each monitoring station for each day, the total number of records would be in excess of 2 billion. Trust me, I know this, because I did this last year! It wasn’t fun and it wasn’t an efficient use of my time.
To avoid having to do that process again, I created an Alteryx workflow to directly process the raw flat-files from any or all monitoring stations. The advantage of doing this is that the size of your individual data sets are manageable and are easily processed with Alteryx and Tableau. If you concatenate all the files, Tableau will bog down under the load of hundreds of millions of records for any particular data type such as temperature, precipitation or snow fall depth.
A Non-Ideal Flat-File Structure
To understand how this is done, I start with an examination of the flat-file data structure used to store the climate data. Figure 1 gives the details of how the daily data is stored in monthly-based records.
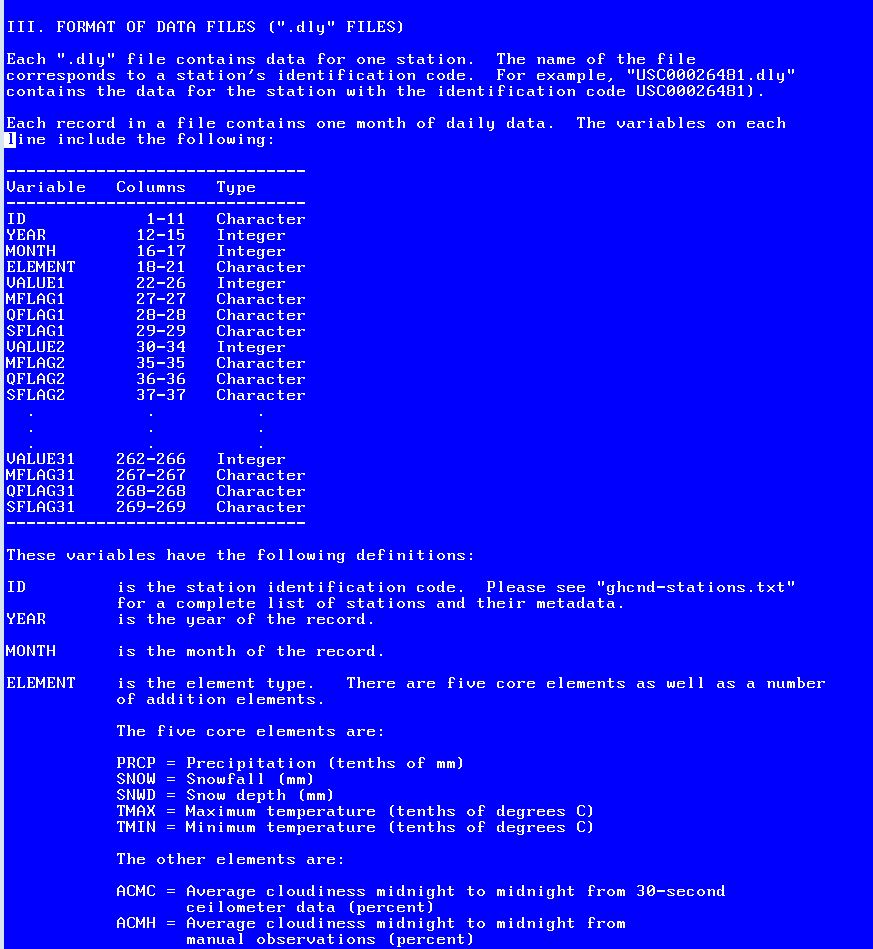
Figure 1 – Monthly data structures are used to store the daily data.
Each Record Represents a Month of Data
Within each record, there is a repeating sequence of five values including the fields called element, value, mflag, qflag, and sflag. This sequence is repeated 31 times because there is a maximum of 31 days in a month. Also included in each record is the month and year of the readings.
The field labeled “element” describes the type of data measurement stored. There are a whopping number of these (easily over 100 types of readings!), which also makes these files non-ideal. Luckily, there are only five core elements as shown in Figure 1 and Alteryx easily splits the data out into separate files for each type of reading. Alteryx will produce output files for each type of “element” measurement but I filter the allowable output types to include only the five core elements.
Notice that there is no complete date field, only integer representations of the month and year that the monthly record of data represents. The day number is implicit in each position of the five repeated fields. The first set of five represents day 1, the second set represents day 2, etc. This compact data structure causes the first bit of consternation because a daily date is definitely needed when you want to visualize data over time. To generate the daily dates, you have to process the flat-file across all 128 fields per record.
Figure 2 shows an excerpt from the Excel file I built for creating the Alteryx (*.flat) file settings needed to read the climate data. Click here if you want to download a copy of this file. The content of column H are the flat-file settings needed by Alteryx to read the content of the climate data files. The complete flat-file configuration is also included in this Excel file.
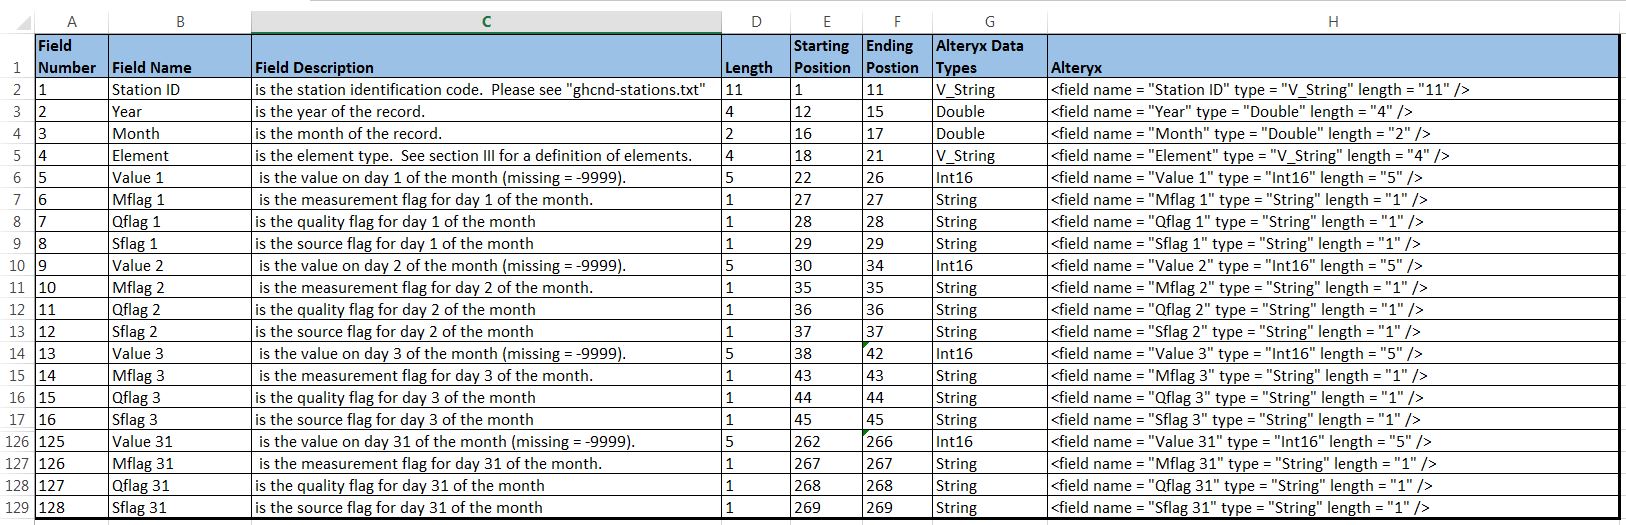
Figure 2 – Creating the flat-file settings needed by Alteryx to read the climate data files.
Overcoming Problem #1 – Creating a Daily Date
Figure 3 through 5 show the Alteryx workflow steps and the detailed settings needed to create a date when the data structure does not have an explicit day included in any field. The day used for each reading has to be stripped off of another field name and then used in some formulas to create a valid date. Those steps are shown in Figures 4 and 5.
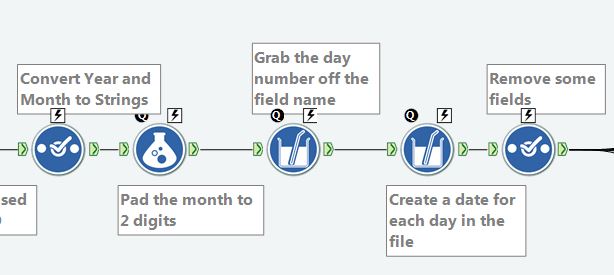
Figure 3 – Alteryx workflow designed to create a daily date for each measurement set.
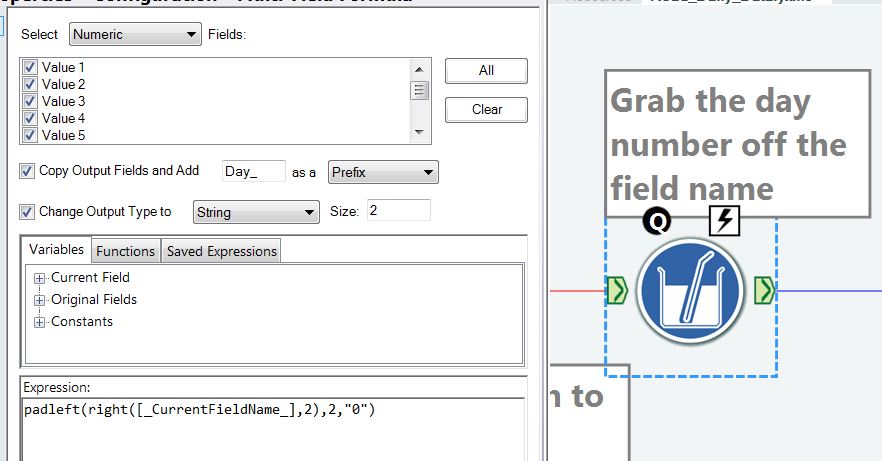
Figure 4 – Stripping off the implicit day number from the field named value xx.

Figure 5 – Creating the daily date by concatenating the year, month and day. Note that the created variable is converted to a date and there will be 31 of these created for each potential day in a month.
Overcoming Problem #2 – Transposing a Monthly Record to Daily Records
Once you have created daily dates, you now have to process each monthly record such that you transpose the record from monthly to daily settings. Luckily, this is easily done in Alteryx.
Figure 6 shows the settings required to transpose the newly-created daily dates. Since these dates were created at one time, they are all stacked together at the bottom of the heap as shown in Figure 6.

Figure 6 – The settings need to transpose the daily dates from a monthly (horizontal) structure to a daily (vertical) structure.
In a simultaneous operation, the four other monthly records of Values, Mflag, Qflag and Sflag all also have to be transposed from a monthly (horizontal) to a daily (vertical) structure. Figure 7 shows the setting used to convert the Values field. Notice that these fields are not all stacked-up on top of each other because of the original data structure groupings. You have to methodically go there an pick each of the 31 fields to transpose.

Figure 7 – The settings need to transpose the daily values field from a monthly (horizontal) structure to a daily (vertical) structure.
Once the transposing operation is complete, the five fields need to be joined together to form daily records. Figure 8 shows the Alteryx workflow settings for making this occur.

Figure 8 – The Alteryx settings for joining the transposed records together by field positions. These operational settings only work if the number of values in each of the transposed arrays are equal. In this case they are, with 31 values per month. If different record lengths exist, you have to establish a more complex workflow to create a successful union, but it can be done.
Final Thoughts
The operations shown above were necessary because of the flat-file structure used to store the climate data. By saving 62 bytes per record by not storing a daily date, the original designers forced us to be creative to be able to generate a daily date. Fortunately for us, Alteryx gives us all the tools necessary to complete operations like this even when the data structure is non-ideal.


Good post!
Pingback: How To Build An #Alteryx Workflow to Visualize Data in #Tableau, Part 3 | 3danim8's Blog