Introduction
In this article, I evaluate the effectiveness of my Tableau blog. To do this, I use Tableau fueled with data that was extracted from the WordPress content management system. I did this self-evaluation to understand how I can become a better blogger and to quantify what kind of readership response a good Tableau article will receive over time.
Background
I previously wrote a two-piece article about the lessons I have learned as a Tableau Blogger. Click here to read Part 1 and click here to read Part 2. After writing that series, I have learned two additional interesting things that I will use in this article.
One of my findings is that the non-quantitative approach I used in Part 1 to describe the lessons I learned was way more successful of an article than the quantitative approach I used in Part 2. That surprised me greatly. Prior to writing the series, I thought the results would be reversed. For this reason, I am going to keep that result in mind as I write this article!
As for the second finding, I’ll just keep that to myself for a while longer. I promise to tell you about it in an upcoming article.
The Key Measure Used For Evaluating My Blog Performance
I have determined that there is one good key measure for me to use when evaluating the success of the articles I write. This measure is simply the average number of hits per day that an article receives. If I write an article that gets viewed 21 times in the first 7 days, then it has a 3 hits per day average. The number of article hits per day is my key measure.
You might think that this method would lose accuracy over time because as articles age, they tend to be forgotten. There might be some truth to that for some materials. However, in my case I am trying to write about technical methods that help people solve a wide variety problems, using great software that has a growing user-base. The growing user-base is key because as more people learn to use these software tools, they will invariably learn from blogs (including mine).
My Experience and What I Write About
For this reason, I try to write articles that can “stand the test of time”, so to speak. So for me, I’m willing to put my articles to the “long-term” test to see if they can remain interesting and salient as they age. I want to write about topics that are fundamentally important to users of Tableau (and Alteryx). This isn’t easy to do because you have to identify the topic and then write the solution.
Based on my daily use of Tableau for over seven years, I have identified a lot of things that can grind a Tableau-user down to the point of frustration. I try to write about methods that can help users avoid or alleviate those painful situations.
I also write about things that I think the Tableau programmers should fix or improve. I don’t really expect that those articles will have any impact, but you never know. At least these types of articles will help others avoid the problem areas I have found.
Therefore, my articles are not focused on any one approach or topic. I tend to cover a wider variety of topics than most bloggers. I’m more like a data mechanic that knows how to prepare data for analysis using methods of visual, mathematical, statistical, spatial and predictive analytics.
Not only do I write about Tableau, I also write about Alteryx, as well as other software tools and programming techniques that help us get jobs done efficiently and effectively. I also dabble in writing about our human condition, by writing articles about a guy named Rich Roll. Rich was just voted the #31 most influential person in the world of health and fitness. As far as achieving a better state of health, he is my #1 hero. By eating a plant-based diet, my energy, stamina, and brain function has improved noticeably over the past two years and Rich is why all that has happened.
I also try not to be biased in any way in my writing, although when you have passion for companies and products like Tableau and Alteryx, it is hard not to be biased!
The Method Used to Complete My Blogging Self-Assessment
Great baseball hitters manage to get a hit about 3 to 3.5 times per 10 at bats. There are about 30 great NBA basketball 3-point shooters that will hit between 4 or 5 shots out of 10 taken. Sometimes we just have to realize that we don’t have to be perfect to be pretty good.
If it is possible to write a really good article every 3rd, 4th or 5th time you write one, then I think you are doing great work. With that mindset, I am driven to understand how well I have done in the first year and a half of blogging.
I wrote an article that looked at using the “Best of Tableau Web” data to identify promising Tableau bloggers. I speculated that using this data is reasonable for assessing a blogger’s performance because various Tableau software employees have selected these articles over the past couple of years.
Each month, I suspect that a wide number of Tableau-based articles were reviewed by various Tableau employees and about 20 to 22 selections were made for that month. I have no idea how that process worked, so I cannot speculate on how much effort went into the selection process. For me, I didn’t even realize that my articles were being selected for many (at least 6) months after the first one was chosen.
There were three reasons for that. First, I didn’t see or know about the “Best of Tableau Web” publications for quite a while after I began blogging, even though these selections started a full six-months before I started blogging. Second, I was a relatively new blogger that was conducting a big experiment by just writing in a vacuum, desperately trying to manage a family and work. Lastly, I have never been to a Tableau conference, so I wasn’t really in tune with some of special things that go on within the Tableau community.
So for these reasons, I feel that I can use this “Best of Tableau Web” data set as part of my self-evaluation. I assert that my articles that have been chosen are a reasonable representation of my good Tableau blog content. In other words, I can use the performance of my selected articles as benchmarks to compare against my non-selected articles to see how effective my blog articles have been overall.
[Note to self – don’t ever be a dumb-ass again by writing this much of an article without having already completed the work! At the time of this writing, I don’t know what the results will be! This is a scary situation I created for myself! Now I’ve got to crunch some numbers…]
Results of My Blogging Self-Assessment
To complete my analysis, I simply calculated the hits per day for every article I have written. I created a Tableau Public workbook with a few dashboards to help me understand the article performances.
As shown in Figure 1, I have plotted all of my articles that have achieved a reading rate greater than 4 hits per day. I chose to be this selective because only 3/21 “Best of Tableau Web” articles have been able to sustain this rate. Hey, it isn’t much, but I’m not writing about the hottest hollywood starlet! I’m not trying to write “viral articles” that can generate huge response rates (although if one happened to me, I wouldn’t be too disappointed!).

Figure 1 – My articles that have achieved at least 4 hits per day on average (click image to expand).
The first row of “Selected Best of Tableau Web” are the only three articles of the twenty-one award winners that have achieved 4 hits per day. These are the best of my work according to Tableau, and a threshold of 4 hits per day is a current-day, good indicator of a high-performance article in this community of blog readers. One of the three articles (data reshaping) was also selected as a “Best of 2014” article by Tableau, giving further credence to its relative merit as a good article.
The most interesting finding to me is that I have written 12 other articles that have achieved the same level of performance as my best articles as selected by Tableau. Therefore, these 15 articles represent the best of my work as judged by my blog readers.
Although I really like Figure 1 in that it tells a great story over time, Figure 2 paints a slightly different picture of the same data.
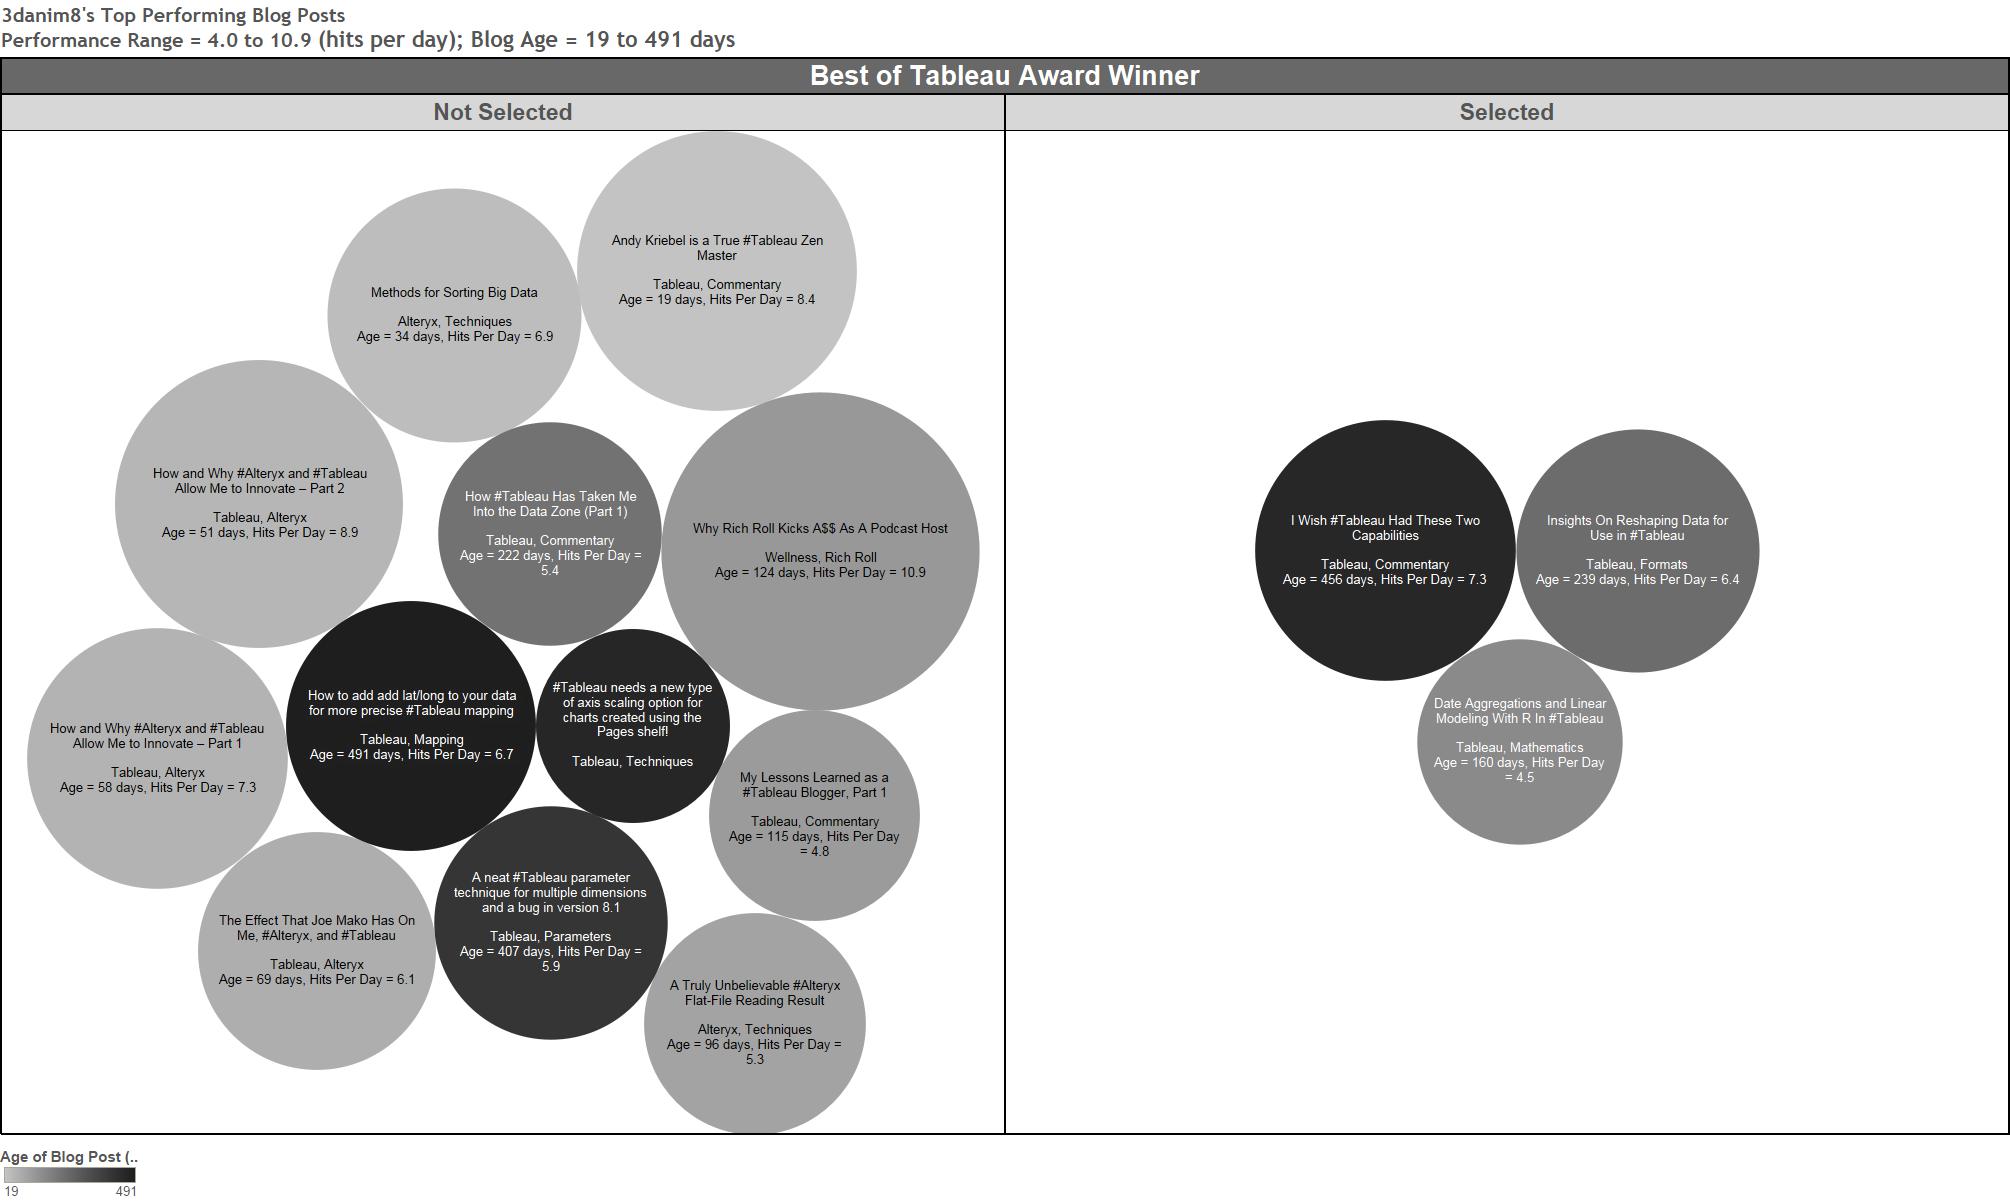
Figure 2 – My best articles as judged by the readers of my blog (click image to expand).
What Figure 2 indicates to me is that I cannot solely depend upon winning a “Best of Tableau Web” award as being indicative of how my blog is performing. The reason for this is simple. Tableau has too much to review. They can’t possibly spot all the excellent work being produced. Additionally, I write about other topics (primarily Alteryx), so I don’t expect those to be selected.
Blog readers, however, do spot this work and the reward you receive is by having people share your work through social media exchanges. Twitter re-tweets and Twitter favorites are indicators to me that my work is well-liked. Direct blog post comments are also a great sign that people appreciate what you are doing.
So what does this mean? Have I performed well enough to be considered a “good hitter” or a “good 3-point shooter”. Based on the readers response to my material over the lifetime of my blog, I have written 15 good articles out of 108 so far (using the 4 hpd criteria). That means that I am only reaching my goal of excellence only 1 out of 7 times (14%). This includes a lot of articles there weren’t expected or intended to get big readership on topics such as science, family, etc.
The Bad News and Then the Good News
The bad news is that I’m not satisfied with this result. The good news is that Figure 1 shows that I may be learning to be a better blogger.
I think that I am starting to figure some things out with respect to technical blogging. If I look at my success rate in 2014, I wrote 12 successful articles out of 58, or 21%. If I take out the silly articles written for my son, my success rate rises to near 24% (or nearly 1 out of 4).
My goal for 2015 will be to achieve a success rate of 1 out of 3. With careful planning an execution, I think I can achieve this mark.
I hope I have the courage to write other articles that were as tough for me to write as my favorite all-time article. Those pieces of work are worth the effort they take to create.
Final Thoughts
Just as I realized that the receiving a “Best of Tableau Web” selection is a nice pat-on-the-back and it definitely make you very happy and proud when you get one, it isn’t the only measure of performance that Tableau bloggers have at their disposal. It is possible for everyone else to perform this type of self-evaluation using their own blog stats. I think it is a good exercise to for all bloggers to do to help understand how we are doing.
From my perspective, much of my development as a blogger has been shaped and refined by studying the work of others. In addition to the people that were directly mentioned in my “Best of Tableau Web” post, there are some unbelievable people working with and writing about tools like Tableau and Alteryx. When you take the time to read their work, you quickly realize that the quality of what they write is stunning.
Great blog posts are almost capable of reading themselves to you. They engage you for a few minutes or possibly a bit longer if they are very technical. They are self-contained and teach you meaningful concepts. They make you want to come back for more. Great posts make you want to write a comment to the author to thank them for taking the time to do that work. Those are the ways that you can spot a great blog post.
So if you want to see some of what I am talking about, go find the work of the following people. Their work will automatically capture you. These are approximately my top 40 people to follow (in first name order, as well as several others I’m forgetting at the moment), and they inspire me to do better analytics work on a daily basis:
- Alan Walker
- Andy Cotgreave
- Andy Kirk
- Andy Kriebel
- Anya A’Hearn
- Ben Jones
- Bora Beran
- Brad Llewellyn
- Chris Gerrard
- Chris Love
- Craig Bloodworth
- Dan Montgomery
- George Gorczynski
- Jeffrey Shaffer
- Jen Underwood
- Joe Lipski
- Joe Mako
- Jon Peltier
- Jonathan Drummey
- Joshua Milligan
- Keith Helfrich
- Kelly Martin
- Mark Jackson
- Matt Francis
- Michael Mixon
- Mike Bostick
- Ned Harding
- Nelson Davis
- Noah Salvaterra
- Paul Banoub
- Peter Gilks
- Ramon Martinez
- Roberto at “Data * Science + R” blog
- Russell Christopher
- Ryan Robitaille
- Shawn Wallwork
- Steve Wexler
Certainly the universe of Tableau, Alteryx, and General Analytics talent is bigger than this list. These just happen to be the people that I can count on to deliver great content and to help me, time and time again. They are the people that I have come to know through the world-wide-web. They all are top-flight performers in my eyes.
The funny thing is, I haven’t met any of these people in person! I have talked to a few on the phone, but I only know most of these people through their work. So thanks to all of you for lending me a hand and I hope everyone has a great 2015!
If you like this article and would like to see more of what I write, please subscribe to my blog by taking 5 seconds to enter your email address below. It is free and it motivates me to continue writing, so thanks!


Pingback: You Should Consider Following These #Tableau Bloggers | 3danim8's Blog