Introduction
This is part 3 of the 3danim8 blogging experimental analysis. In this article, I answer a question that I originally posed to myself nearly four years ago.
The question is this: Are speed-burner articles (the Hare) or slow-burner articles (the Tortoise) more important to the long-term sustainability of a technical blog? Speed-burner articles get a lot of attention right after publication but may not have great readership performance over the long-term. Slow-burner articles are written with a focus on software fundamentals to be able to teach more new users of the software over time.
Background
Over 160 articles were written over 2.5 years, as part of a scientific blogging experiment that was designed to quantify many aspects of writing a technical blog. This article is the third part of the quantitative analysis of this experiment. I promise to keep this one short and sweet, but there is a lot to learn if you are so inclined.
- Click here to review the official ending of the experiment (The Conclusion and overview of why I did the experiment)
- Click here to review part 1 of the blogging experimental analysis (Geographical expansion of the blog)
- Click here to review part 2 of the blogging experimental analysis (Quantifying the importance of the terms “How, How To, How To Use” in blog titles)
The Speed Burner Articles (The Hare)
I think that every blogger would love to write an article that goes “viral”. The attention they get from writing an article like that has been described as scary, intimidating, but also almost intoxicating. Well, I don’t know what it feels like because I have never written one!
It might not be possible to intentionally create a viral article. I think they happen by accident. The articles I have written that were fastest-out-of-the-gate (i.e., my speed-burners), were almost always the least expected. Almost every time I wrote an article that gained early traction, I was surprised.
On a relative scale, my speed-burner articles are trivial compared to viral articles. However, compared to most normal articles I write, the fastest accelerating articles have a fairly good readership.
In this article I’m going to compare the speed-burner articles to the more slowly-moving articles to see which is more important to the long-term sustainability of 3danim’s blog.
I have decided to quantify the speed-burner articles in a simple way. Starting on the day an article is published, I just sum the number of times an article is read. For each day that passes, the number of reads will either stay constant or continue to grow.
To understand how my speed burner articles developed, I decided to create a series of horizontal bar charts. Figures 1 through 5 show the total number of reads for the top performing speed-burner articles at times = 3, 7, 14, 21, and 28 days after publication. The color coding is set according to he category of the article (Tableau, Alteryx, Rich Roll, Tableau+Alteryx or Everything Else).
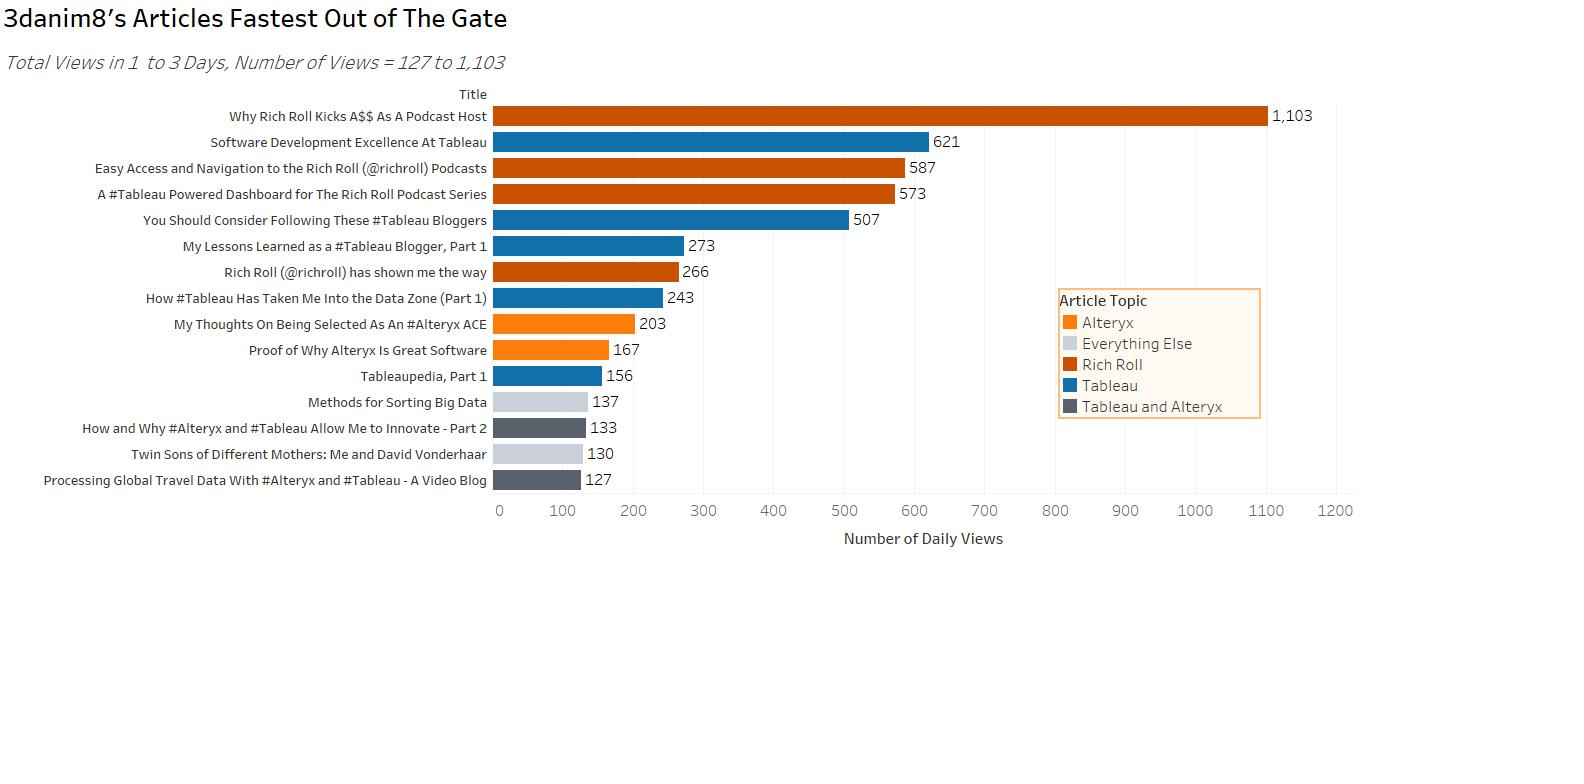
Figure 1 – The top performing articles at 3 days after publication (click to zoom).
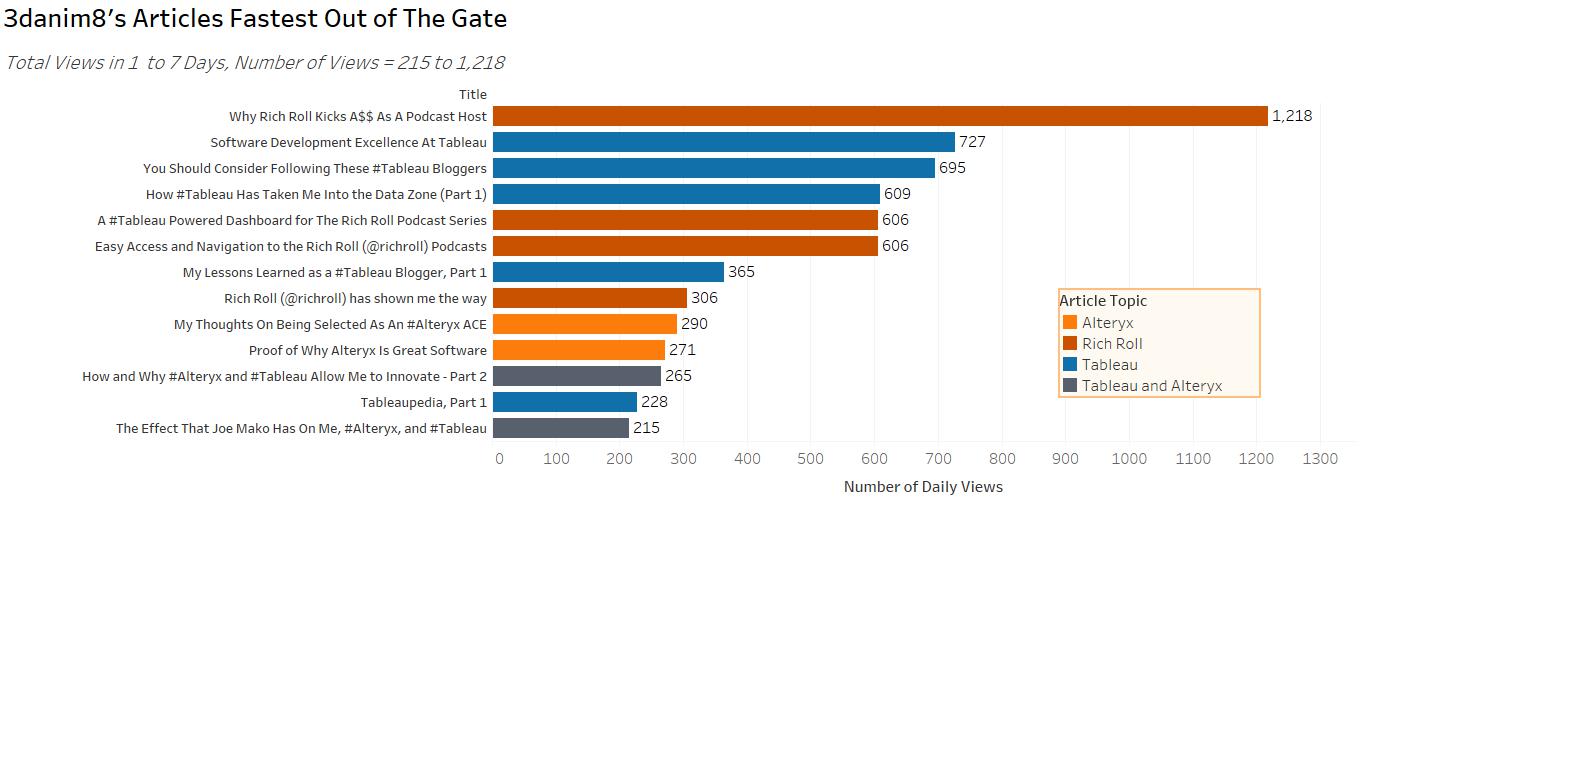
Figure 2 – The top performing articles at 7 days after publication (click to zoom).
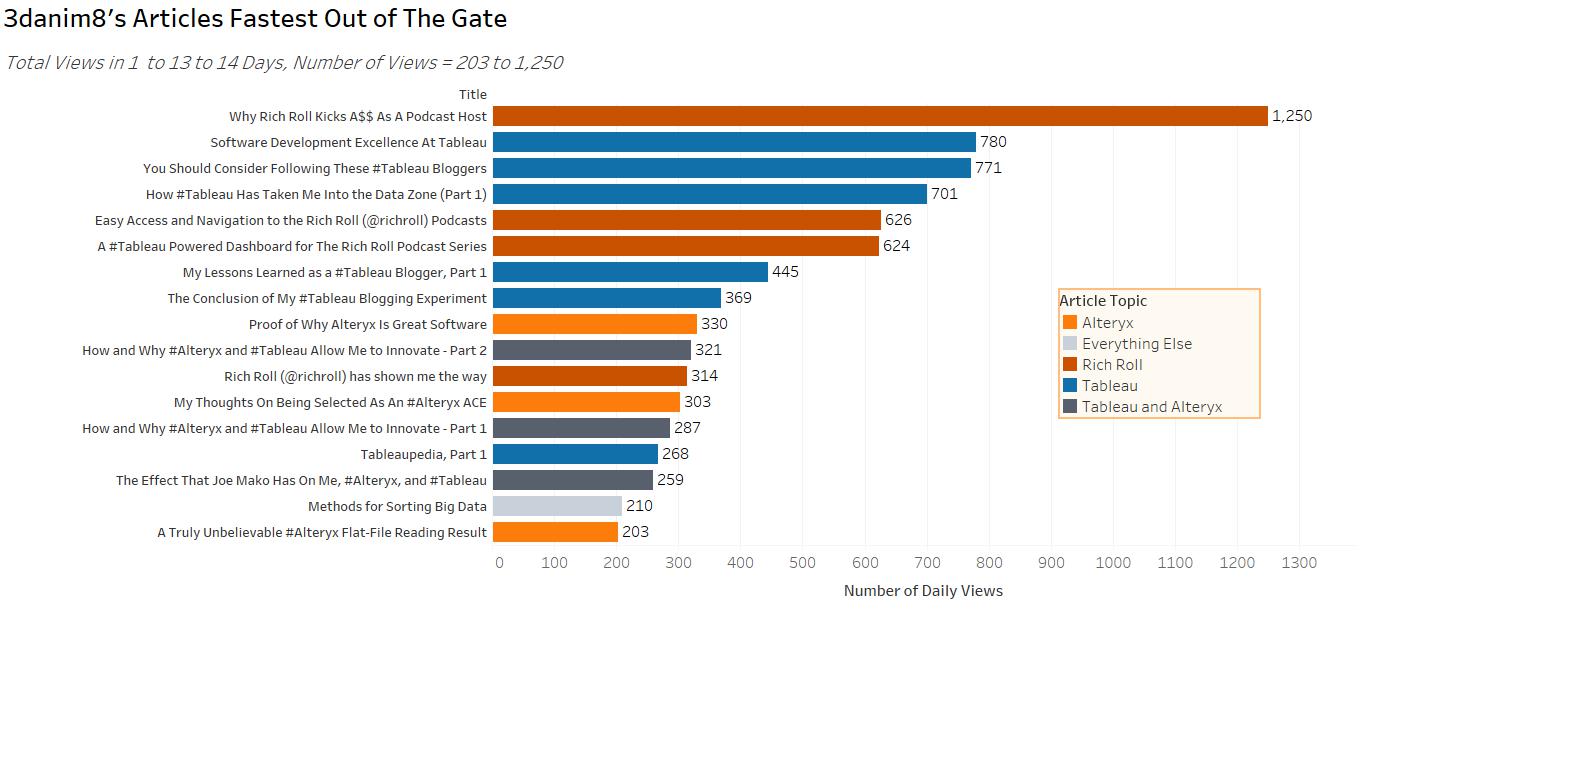
Figure 3 – The top performing articles at 14 days after publication (click to zoom).

Figure 4 – The top performing articles at 21 days after publication (click to zoom).
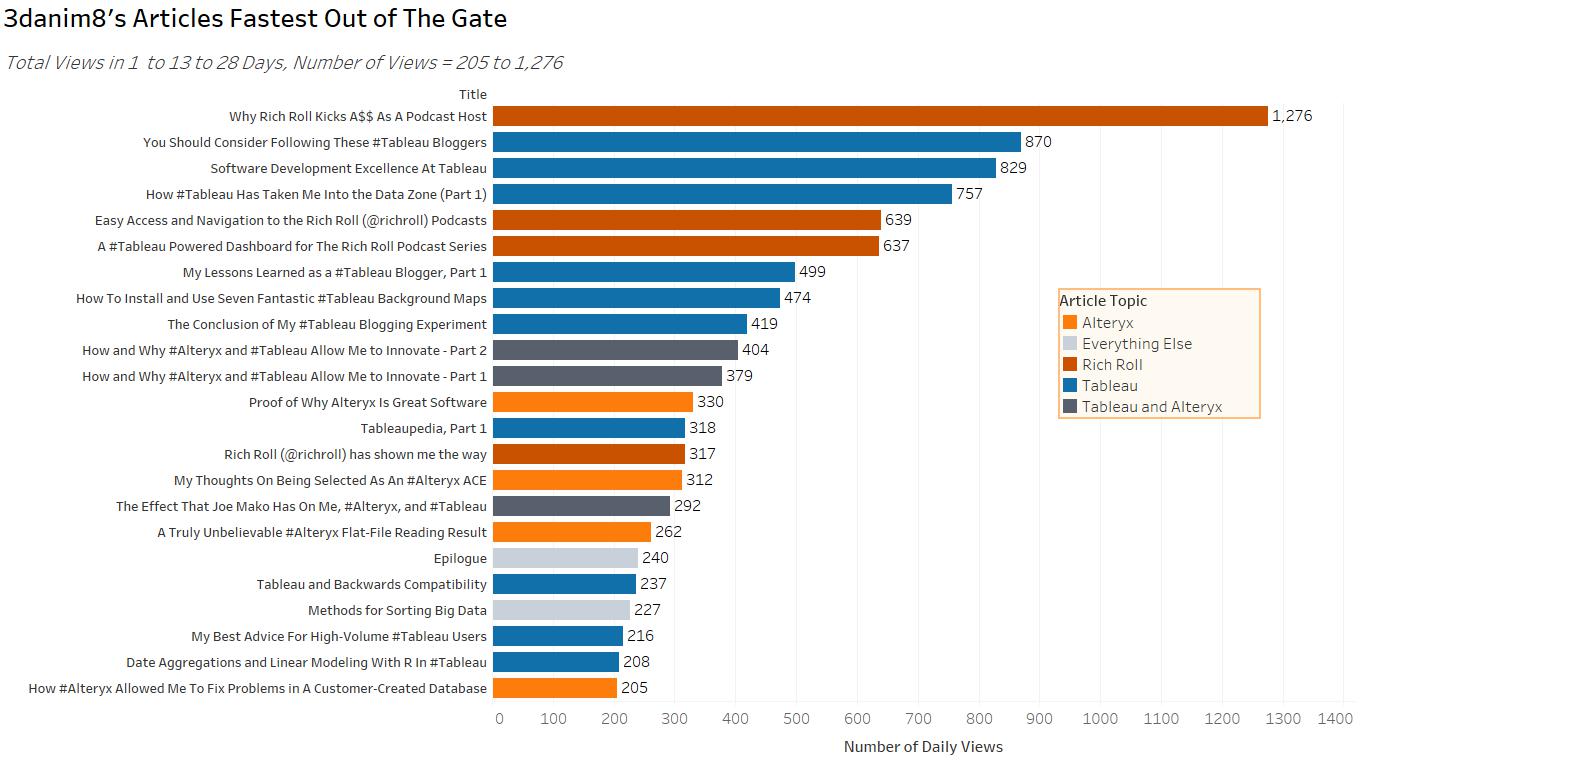
Figure 5 – The top performing articles at 28 days after publication (click to zoom).
Insights From Figures 1 to 5
There are a number of insights embedded in these 5 figures. By taking the time to review each figure, it is very interesting to see how the articles jockey for position, much like horses in a race.
My first insight is that Rich Roll has a very responsive social network. With four articles appearing in my top 10 speed burners, if Rich takes note of my articles, there is a big influx of traffic to my blog. The Rich Roll articles are my prototypical speed-burner type articles.
Second, most of the Tableau articles that became my speed-burners were completely unexpected. When I wrote them, I fully expected them to have little to no readership. In fact, many times I remember saying to myself: “This is stupid, I don’t know why I’m even publishing this” as I was hitting the publish button.
My ability to recognize what might become a speed-burner article is essentially zero, especially when it comes to Tableau. Additionally, when I write an article that I am sure will have good readership, it bonks.
Third, considering the far fewer number of articles written about Alteryx or Alteryx and Tableau combined, there were quite a few of these article that had really good acceleration after being published. This surprised me a bit but I’ll have a lot more to say about the Alteryx article performances in an upcoming article.
Starting with Figure 5 as a basis, I decided to answer my question in the following way. I wanted to quantify how many of the speed-burner articles ended up being widely read over the entire lifetime of the blog. In other words, I wanted to determine how important the speed-burner articles good are for the long-term health of the blog. I had a suspicion that they just provided short bursts of readership around the time of publication but then they faded away.
Speed-Burners (The Hare) Vs Slow-Burners (The Tortoise)
The method I used to make this comparison is simple. First, I ranked all the articles by the number of reads at 28 days. The top 20 something of these is shown in Figure 5. There were only a few articles that haven’t yet matured to 28 days. Second, I ranked all articles based on the entire 3.5 year history of 3danim8’s blog. Once I had both sets of rankings, I did the analysis.
Figure 6 highlights the top 50 speed-burner articles. These articles are shown in the shaded grey vertical band on the left-side of the figure. Note that the highest performing speed burner article is ranked 1, near the lower left corner. The circle sizes are set to the total readership over the lifetime of the blog. It is easy to notice how many of the speed-burner articles are very small circles, which means that these articles fade-out of readership very quickly.

Figure 6 – The top 50 speed-burner articles are shown in the vertical grey shaded area (click to zoom).
Figure 6 highlights the top 50 all-time articles. These articles are shown in the blue shaded horizontal band in the lower part of the figure. It is easy to notice how many of the top performing all-time articles were NOT highly ranked at 28 days.

Figure 7 – The top 50 highest performing articles are shown in the blue shaded area (click to zoom).
Figure 8 completes the analysis. The lower left corner of the figure shows the intersection between the speed-burners and the slow-burners. Of the top 50 speed-burners, only 16 of these ended up in the top 50 all-time articles.
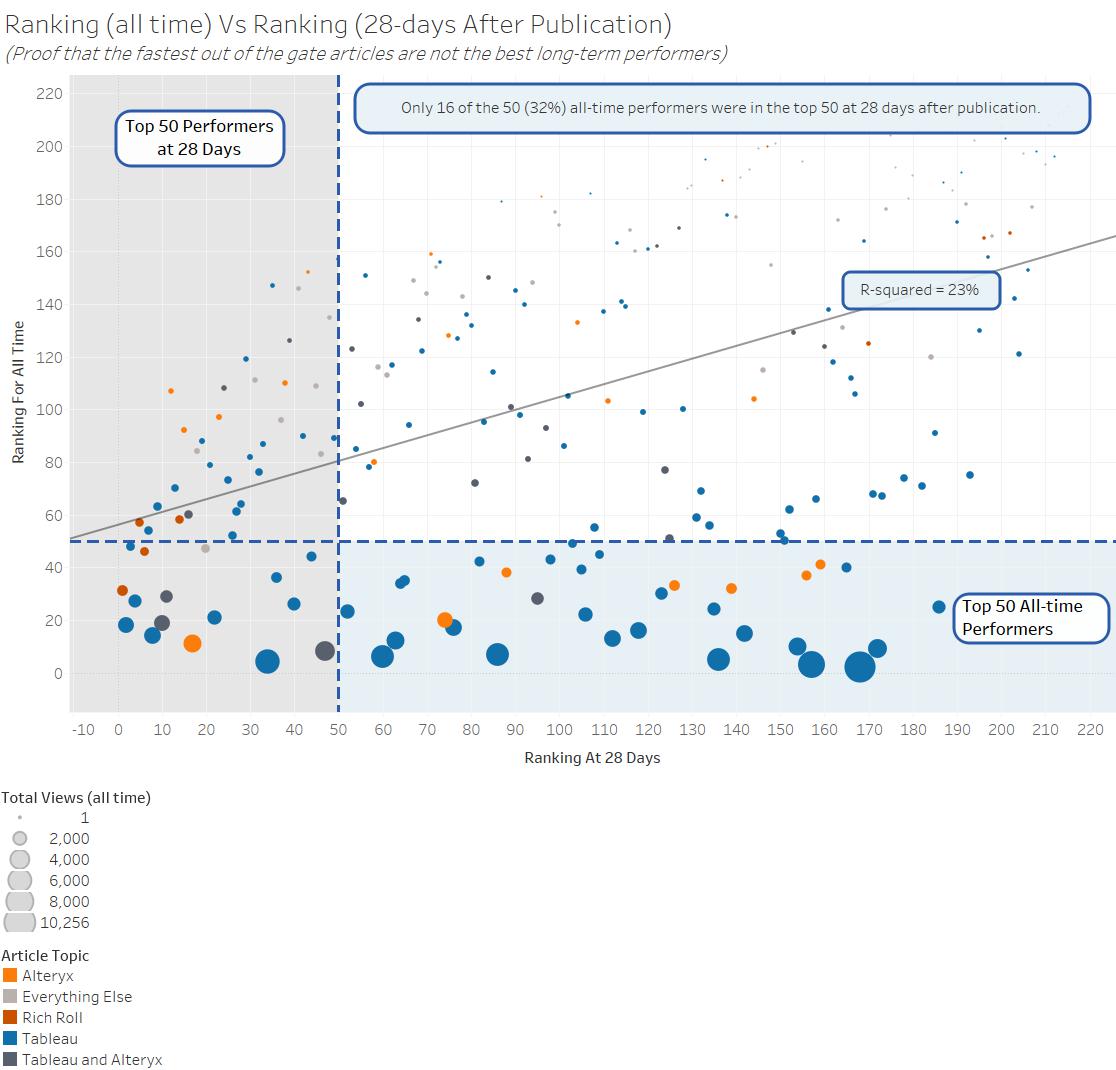
Figure 8 – Only 16 of the speed-burner articles made it into the top 50 all-time articles.
What this means is that 32% (about 1/3) of the all-time articles started their life as speed-burners. The other 68% (2/3) of the best articles didn’t leap out of the gate. The readership of these articles built more slowly over time and they continue to have staying power over several years.
For completeness, Figure 9 shows the top 25 all-time articles from 3danim8’s blog through August 2016. Clearly, the Tableau articles dominate the top 25, but then again, many of these articles have existed much longer than other categories like Alteryx.
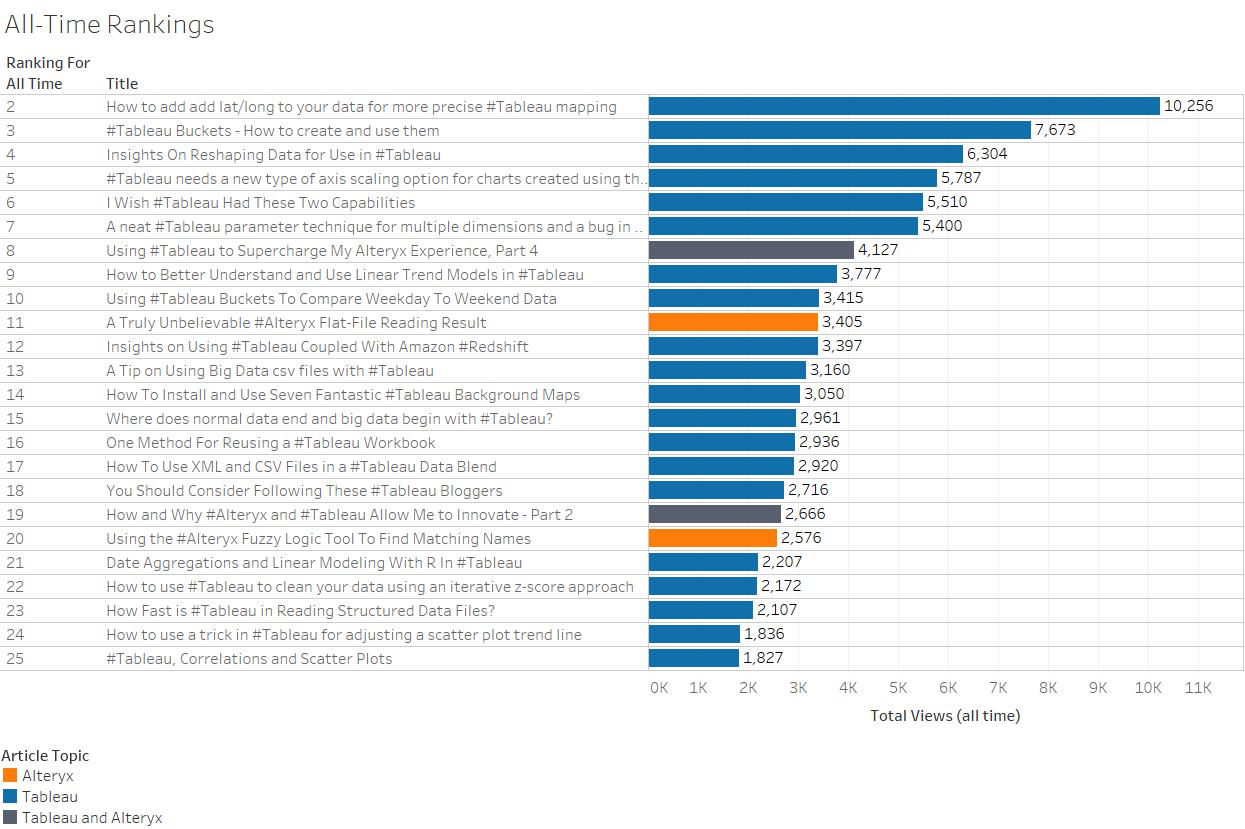
Figure 9 – The Top 25 all-time articles from the 3danim8 blogging experiment, through August 2016.
What I Have Learned From This Analysis
Based on this analysis, 5 things are very clear to me.
- Slow-burner articles are a lot more important to me because they provide the continuity in readership for 3danim8’s blog. What this actually means to me is that my work continues to help people new to the software platforms, which is one of the primary reasons I write this blog.
- Slow-burner articles focus on explaining software fundamentals. While reviewing the largest dots in Figure 8, it became very apparent that my best performing articles are squarely focused on explaining software fundamentals through the use of illustrative examples. Many times these examples included problem solving techniques.
- Slow-burner articles build readership over time because people find them when they need them. Slow-burner articles are not that interesting to experienced software users because they already have the knowledge contained in those articles. Blog writers need to be patient to allow slow-burners enough time to diffuse into the software community and for new software users to arrive on the scene.
- Speed-burner articles are exciting because they can create a lot of short-term traffic on the blog. The problem is that 2/3 of them fade off to oblivion in a short amount of time (days to weeks). The effort needed to create these articles is just as much as the slow-burners, so the slow-burners are more important to the long-term sustainability of the blog.
- With a 23% correlation coefficient between the speed-burner article rankings and the all-time rankings, it is clear that it is not possible to reliably predict how strongly an article will perform over the lifetime of your blog based on the first month of its existence. You shouldn’t get too excited about an article when you see it gain a lot of traction early in its lifetime. However, if the article contains solid fundamentals, chances are better that it will perform great over time.
Upcoming in Part 4 of This Series
I’ll be getting seriously geeky in the next installment of this series. I will literally be visualizing the heartbeat of this blog and explaining how and why article readership can change over time. Thanks for reading.


Excellent analysis – I can totally relate to your appreciation of Tortoise content and why you blog. It is a way to give back to the world. I continue to be inspired by your blogs Ken year after year.
Thanks Jen! It is great to hear from you. You are still an amazing machine, cranking out a tremendous amount of great content. Thanks for all your contributions – you have taught me more than you will ever realize.
Hi Ken, I got the notification for this post when I am contemplating creating a new Tableau blog. Lot of points to reflect and definitely the message that we have to be patient with our tortoise articles is great. Thank you for sharing
Pingback: Text Analytics Improved With Tableau Clustering | 3danim8's Blog
Pingback: 3danim8's Blog - How I Use #Tableau LOD’s To Process Asynchronous Time Series Data