Introduction
It is time to face the cold-hard facts. We love data. We especially love looking at website traffic data to see who is looking at our content. In a sense, I think we are friendly and harmless digital stalkers.
In this article, I examine a couple of different platforms to see how much difference exists between the reported analytics these platforms produce. Google Analytics (GA) and WordPress are the platforms that have created the data used in this 5-month long study.
Writing a Technical Blog Just For The Love of It
Writing a technical blog that maintains readership over time requires effort and determination. For these reasons, I want to understand how to best spend my limited time in producing content. I love the work, but I want to maximize my ability to help as many people as I can learn how to do great quantitative and visual analytics.
For this reason, I have been tracking the analytics on my website for a number of years. Strewn throughout the history of this blog are articles that show how I have used the website traffic data to gain insights on becoming a better blogger.
The website traffic data has been used to help me determine how to build and maintain a data science blog that focuses on learning how to solve problems. Since there are only so many people interested in this topic, I want to do the best that I can to reach as many people as possible. I don’t want to waste time for people by writing things that have little to no value.
As with any form of measurement system, there are bound to be inconsistencies in the reported data when different systems are compared. Over the past couple of days, I decided to compare the results from the two data sources to see how much data variation exists between the systems.
What I found surprised me, so I decided to write this article. Once again, I had to remember my motto:
I treat all data as guilty until it is proven innocent
A Comparison of Website Traffic Data Sources
In this brief article, I include a video that shows the origins of two different sources of the website traffic data I have for my site. One source is WordPress and the second source is Google Analytics. Since I am so new to Google Analytics and that platform is rapidly evolving, I just decided to show a few features of that system.
Since my blog is hosted on WordPress, I am able to download daily details of every article written. This data is maintained and managed by WordPress. The content management system for WordPress is awesome and keeps getting better.
The level of detail for this data includes activity data for every article ever written for every day that exists in the blog history. If you want to see how I download the WordPress data, you can read this article. Additionally, you can read this article for insights on how I process this data.
The second source of data I have originates in Google Analytics. I have only had this form of website traffic monitoring running for about 5 months. This limits the time frame of the study.
Google Analytics does not give me the same level of detail as WordPress does (i.e., by article), but it does record data down to the hourly level. Hourly data cannot be downloaded from WordPress, although it is likely that they have this information stored in their database.
In some recent work, I used Power BI to connect to Google Analytics and then I exported the daily website traffic data. I matched this daily data up to the WordPress traffic data and created a Tableau dashboard to analyze the results. The video shown below describes the process.
The Results
Although I expected there would be differences, I didn’t expect the differences to be as large and lopsided as they are. In general, Google Analytics reports 16% higher web traffic compared to WordPress. Figures 1 through 5 give insights into the differences between the data sources.

Figure 1 – Hits from Google Analytics vs Hits from WordPress. Each dot represents a day of data and the size of the dot represents the difference in the number of hits between the sources.
Enter a caption
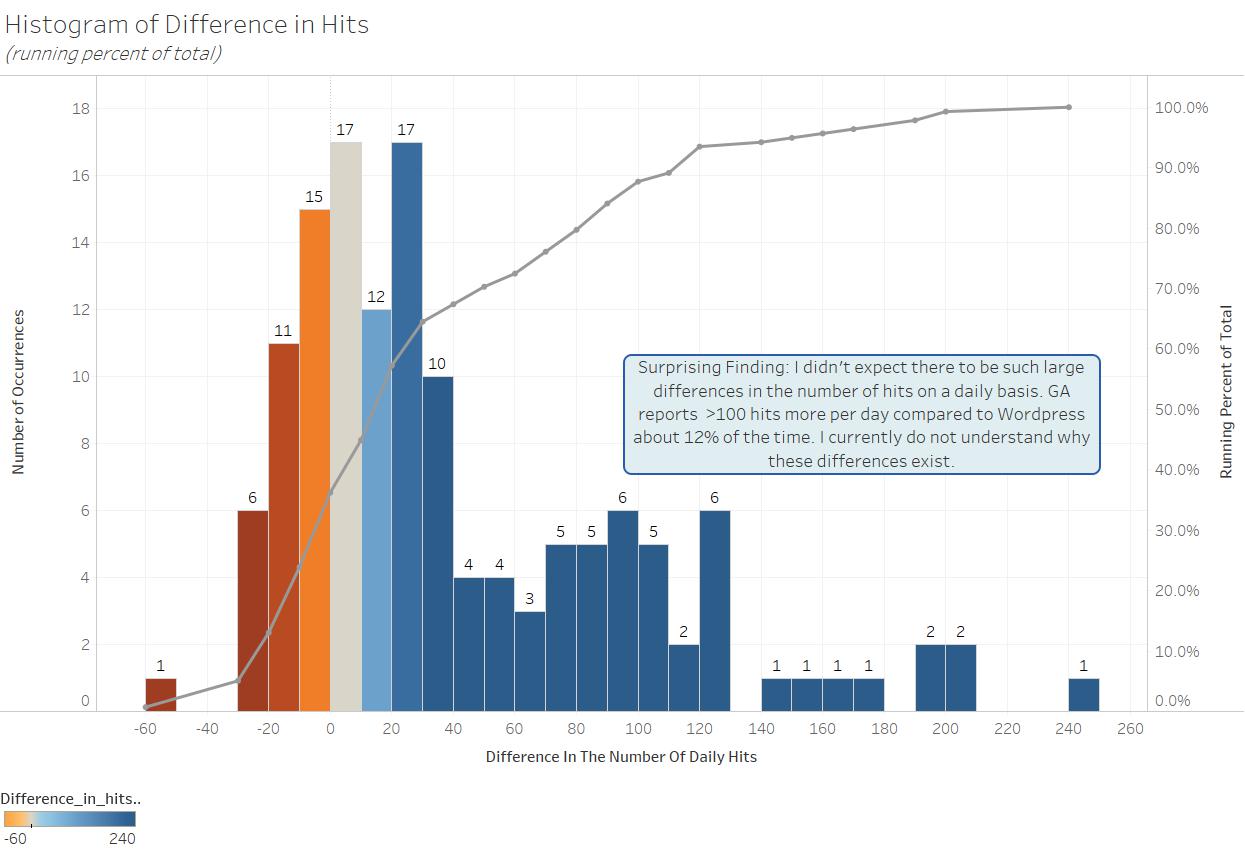
Figure 2 – A histogram of the difference in hits as measured between GA and WordPress. Although GA generally indicates more hits, this isn’t always the case.
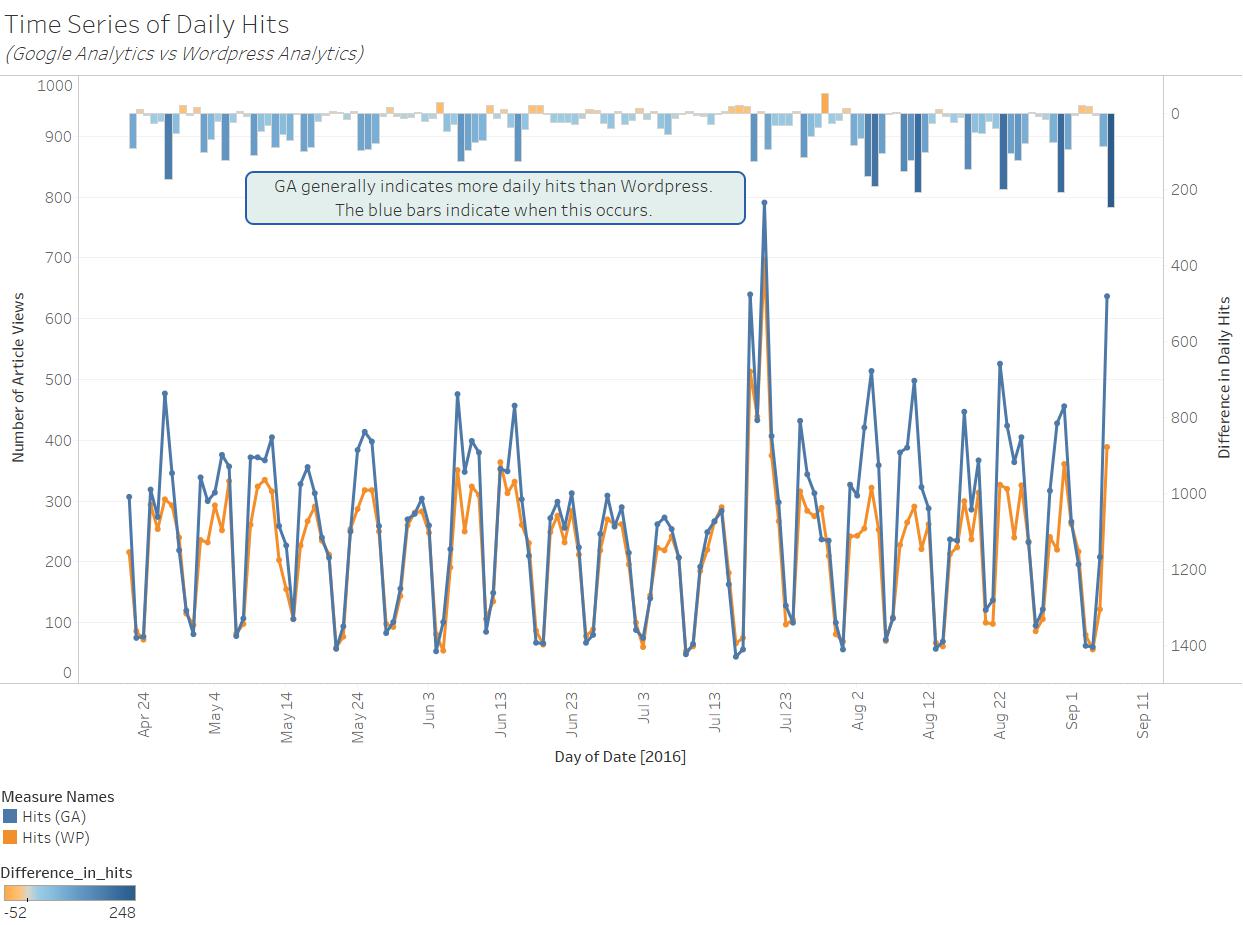
Figure 3 – A time series history showing the comparison of GA and WordPress daily hits.

Figure 4 – A comparison of the total number of hits as reported by GA and WordPress. GA reports about 16% more traffic than WordPress.

Figure 5 – A time series history showing the comparison of GA and WordPress daily hits, with the corresponding z-scores for each day.
Final Thoughts
At this time, I have no conclusive explanation of why these two systems record the website traffic data differently. Conceptually, they should be very close to each other, if not exactly the same.
At first, I thought the higher hits on GA are because GA record activities on my menu system on the blog, whereas WordPress only records the article views and home page navigations. This theory is not supported by the data, however, because there are days when WordPress has more hits than GA.
Due to my inability to determine the differences, I am going to spend a little more time thinking about this finding. I might investigate other metrics that are available in each system to gain a better understanding of why these differences exist.


