Introduction
This is part 3 of a blog post series on combining Alteryx and Tableau to perform a real-world example of an ETL-based analytics project. You can click on the blue links if you want to read part 1 or part 2.
Step 4 – Reading the Daily Climate Monitoring Station Data
The next step of this project is learning how to extract the data from the *.dly files you extracted in Step 2. These files contain the climate data that we will be working with. The content of these files is explained the file called “readme.txt” that you downloaded in Step 2. Figure 1 shows a portion of the content and descriptions of what is stored in these files.

Figure 1 – The field descriptions of the data stored in the *.dly files.
Data Insights
By studying Figure 1, you will immediately identify four things about this data that require your attention.
First, each record in a *.dly file represents a particular type of data that has been recorded. There are five principal types of daily data including:
- PRCP = Precipitation (tenths of mm)
- SNOW = Snowfall (mm)
- SNWD = Snow depth (mm)
- TMAX = Maximum temperature (tenths of degrees C)
- TMIN = Minimum temperature (tenths of degrees C)
There are also about 50 other types of climate data variables (with a total of 128 perturbations!) that potentially are included in any of these monitoring station files. For simplicity in this project, we will focus on extracting only the first 5 types of climate data shown above.
Second, each record represents one month of daily climate data. The line length is 269 characters per month. Therefore, you have to parse each line in these files with the intent on reading all pieces of data. You cannot effectively jump around in time with a file structure like this. You have to read the data and then once you have it stamped with a time and date, then you can decide what time range you want to review.
Third, you will notice that there is no field to represent the day that the readings were taken. The day of the reading is implicit in the position of the data along the line. This means that when you read each line, you will have to assign a day for each field. There is a repetitive structure of four items per day including VALUE (the reading), MFLAG (measurement flag), QFLAG (quality flag), and SFLAG (source flag) that is used to contain and characterize the reading. Since the number of days per month varies, a value of -9999 is used to represent either missing data or days that do not exist in a month.
If you were going to use this data to work on a Master’s thesis or Ph. D., you might need to play close attention to the values of the three flags that are used for the readings, as shown in Figure 2. You would be able to use Alteryx to filter on the flags if there were items that you did not want to include in your analysis.

Figure 2 – The measurement, quality, and source flags used to describe the data. These are found in the file “readme.txt”.
Fourth, you will notice that units used to describe the measurements are a bit unusual and they vary. The original designers of this file structure did this to save storage space, I’d guess, just like they did when they decided against storing the measurement day. Therefore, we will have to convert the units of each of the five variables we will consider to standard units for our analysis. You will use Alteryx to complete the unit conversions.
Reading the File With Alteryx
One very powerful aspect of Alteryx is its ability to read flat files. You can configure Alteryx to read any size or type of flat file that exists. Each field that you will be reading can be directly configured by data type, which is very nice. You can also configure Alteryx to read linux/unix style files (LF) or Windows style files (CR/LF). In this example, you will need to select unix style line endings as shown as the sixth option in the configuration settings shown in Figure 3. If you don’t set this option, Alteryx will read only the first line of data.
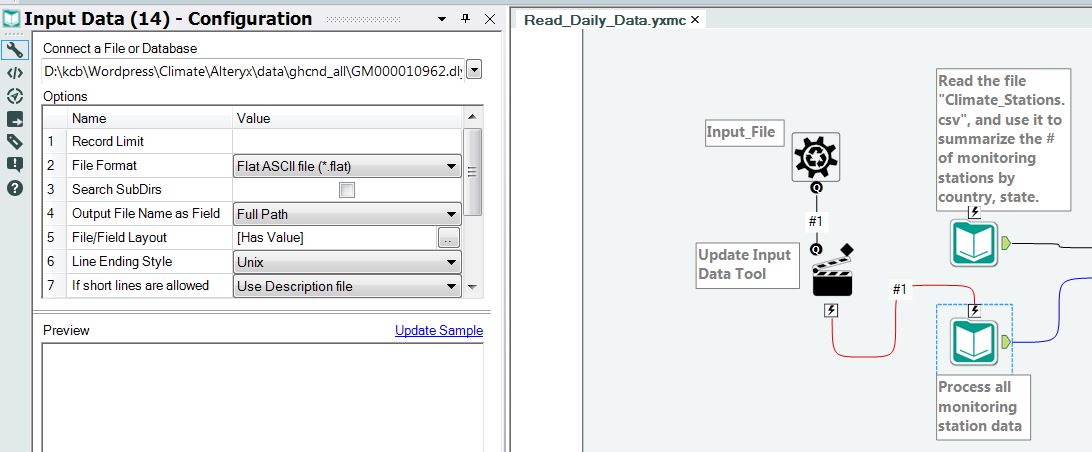
Figure 3 – Be sure to set the Unix line ending style when you read the *.dly files.
For background on Alteryx and reading flat-files, please review this article first. After you finish that, it is mandatory that you read this article, which directly supports the work you are going to do.
For this homework assignment, you have to create the flat-file configuration needed to read the daily data. You need to translate what you see in Figure 1 into the settings Alteryx needs to read the file. Once you take a crack at this, you can download my solution here, which is shown in Figure 4.

Figure 4 – Alteryx flat-file settings needed to read the data from the *.dly files.
Upcoming in Part 4
The project continues by investigating the complete Alteryx workflow for reading the two data sets, completing the joins and necessary operations for producing data for Tableau visualization.
Click here to view Part 4 of this series.
If you like this article and would like to see more of what I write, please subscribe to my blog by taking 5 seconds to enter your email address below. It is free and it motivates me to continue writing, so thanks!


Pingback: 3danim8's Blog - Do You Live In An Area Impacted By Global Warming?
Pingback: 3danim8's Blog - How To Achieve Better Data Comprehension, Part 3